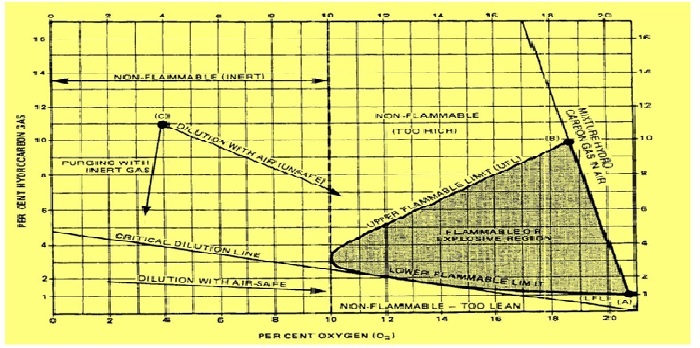
A diagram can be drawn for the range of oxygen/hydrocarbon gas proportions which can be expected in the ullage space of a cargo of crude oil, showing the area in which the properties constitute a flammable mixture. The upper and lower flammable limits are represented by UFL and LFL respectively.
Point A corresponds to the oxygen content of air. The line AB represents the oxygen content of a mixture containing only air and hydrocarbon gas. Any mixture represented by coordinates below this line will also contain an inert gas. It will be seen from the diagram that as the oxygen content is reduced by replacing the air with inert gas, the range of hydrocarbon gas content over which the mixture is flammable is reduced.
When the oxygen level is low enough, below point C, the mixture will not be flammable irrespective of the hydrocarbon gas content. It must be emphasized that the diagram is approximate and is based upon perfect mixing of the gases, nevertheless it can be used as a guide to operating procedures.

Leave a Comment