The curve of statical stability, or GZ curve as it is most commonly referred to, is a graphical representation of the ship’s transverse statical stability.
Transverse statical stability is the term used to describe the ability of a ship to return to the upright, when it has been forcibly heeled by an external force and is momentarily at rest when floating in still water.
RIGHTING MOMENT (t-m) = GZ (m) x DISPLACEMENT (t)
At any angle of heel, it is the horizontal disposition of G and B that determines the GZ value.
As a ship progressively heels over the righting lever, GZ, increases to some maximum value and then decreases until at some angle of heel it becomes negative i.e. it becomes a capsizing lever.
Calculating the value of GZ, at specified angles of heel for a ship’s particular condition of loading, will allow a curve of statical stability, or GZ curve, to be produced.
The greater the values of GZ, the greater will be the area under the curve.
BASIC INFORMATION AVAILABLE FROM THE CURVE OF STATICAL STABILITY
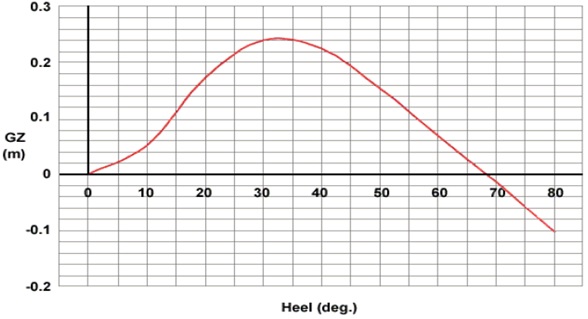
Consider the curve in the previous example. The following information can be extracted from it:
(a) The GZ value for any angle of heel.
This can be used to calculate the moment of statical stability for the ship at that particular angle of heel if the formula:
RIGHTING MOMENT (t-m) = GZ (m) x DISPLACEMENT (t) is applied.
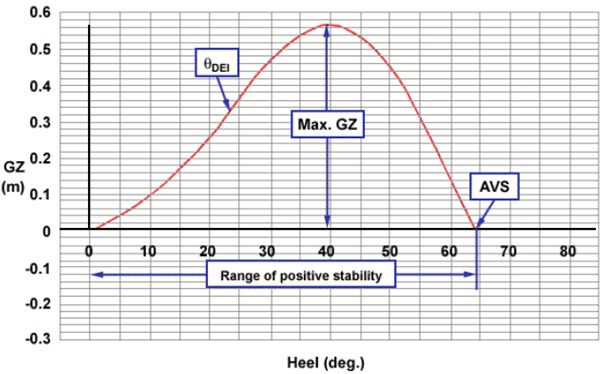
(b) The maximum GZ and the angle of heel at which it occurs.
(c) The range of positive stability and the angle of vanishing stability (AVS).
(d) The approximate angle of deck edge immersion (θDEI).
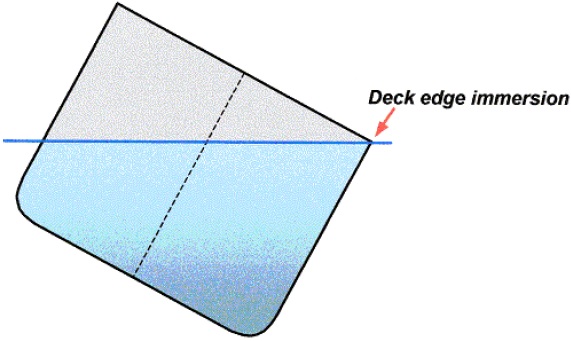
The ship heeled to the point where deck edge immersion takes place.
The angle at which this occurs is identified on the curve as the point where the curve trend changes from increasing steepness to decreasing steepness. This is known as the point of inflexion of the curve.
Leave a Comment